the Hall of Miller and Eric
DRA
Fixing the Hall, Add Jose Cruz
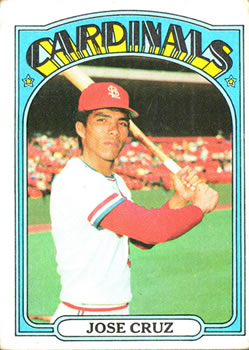 Because the Hall of Fame remains broken since our post of a week ago, we’re going to continue to fix it with the sixth installment of our Fixing the Hall series, looking at how the Hall undervalues players from the 1970s and 1980s. Please take a look at earlier posts on Ted Simmons, Keith Hernandez, Bobby Grich, and Buddy Bell, and Alan Trammell. Today we’re going to focus on the underappreciated Houston Astro, Jose Cruz. Cruz was shunned both during and after his career. He made just two All-Star teams. As you might have predicted, he didn’t get into the game in 1980. In 1985, he had a game that seems fitting, going 0-1 with a pair of walks and a stolen base. When Cruz hit the Hall of Fame ballot in 1994, he garnered just two votes. Aside from having a kid play in the bigs, I don’t think many people have thought a lot about him since. We at the HoME have.
Who He Is
Cruz was born in Puerto Rico in 1947 and made his major league debut for the Cardinals at the end of the 1970 season soon after he turned 23 years old. The Cards never seemed to have a lot of faith in him, as he didn’t eclipse 132 games in four more seasons there. And frankly, the Cards were right to be low on faith. Cruz posted a .247/.333/.379 line for them. That was good for a league average OPS+ of 100, fine for a center fielder, but not something you really desire from a corner guy. After the 1974 season, his contract was bought by the Astros, for whom he would play 13 excellent years, posting a much better .292/.359/.429 with a 125 OPS+, before finishing up his career with the 1988 Yankees.
Why He’s Not In
There are tons of reasons writers almost completely ignored Cruz when he was eligible for the Hall. His only Black Ink was a hit title and a pair of sacrifice fly titles. He had little power, never topping 17 long balls. He never drove in or scored 100 runs either. And his career batting average was a pedestrian .284. He looked far from pretty to voters, and to anyone else who didn’t take a deep dive into his numbers.
Why did he look so mediocre? It’s a combination of era, park, and they type of game he chose to play. The AIR number at Baseball Reference measures the offensive environment in which the player played relative to an all-time average OBP of .335 and SLG of .400. A number below 100 indicates an unfavorable situation for hitters. For his career, Cruz had a 91, which is uncommonly low. The 1968 Los Angeles Dodgers had, perhaps, the least favorable park for hitters ever. The AIR number for Dodgers that year was about 75. But in the three years before and after, using Willie Davis as an example, the AIR numbers were 88, 89, 83, 89, 99, and 87. The average of the six seasons surrounding the most difficult environment for hitters ever is an 89 AIR. Again, for his career, Cruz had a 91. Yes, there are players with lower numbers. Sherry Magee, for example, had an 82. Johnny Evers had an 84. National Leaguers of the 1910s had a particularly tough time. And so did NLers of Cruz’s time, particularly those who played in the Astrodome.
How He Fared
For the decade from 1976-1985, Jose Cruz was the fifth most valuable position player in the National League and the ninth most valuable in all of baseball. Every player in front him is either in the Hall or is part of this series of posts. And each of the seven guys behind him are in the HoME other than Chet Lemon. That’s elite company.
Unfortunately for him, he was never a superstar. By straight WAR, he reached 6+ twice, 5+ only once more, and 4+ another four times. My translations, based mostly on reducing BBREF’s Rfield and replacing it with Michael Humphreys’ DRA, see him as a bit better, adding a season at 5+.
Some Comparisons
In baseball history, Cruz is one of only 36 players with over 200 batting runs and over 70 fielding runs. Of those who the Hall has rejected, there are just nine such players. All but two are of Cruz’s era. And two of those guys are part of this series. If we look at just left fielders with even 75% of Cheo’s Rbat and Rfield, the list is quite exclusive. You have Bonds, Rickey, Yaz, and Simmons. You also have underappreciated Hall of Famer Fred Clarke, HoMEr Jimmy Sheckard, and Luis Gonzalez. Even at 75% of our guy, it’s incredibly impressive company.
Guys within 15 career homers of Cruz who have over 45 WAR include a ton of underappreciated guys. Keith Hernandez, Tony Phillips, and Roy White are HoMErs on the list. Bill Terry and Enos Slaughter make it too. There are some non-HoMErs on the list too, but all of those guys aside from Slaughter have a lower career WAR total.
On an annual basis, Cruz looks a ton like deserving Dodger Hall of Famer Zack Wheat. Here are their best 15 seasons.
Wheat   Cruz
6.9     6.9
6.6     6.5
6.4     5.5
5.2     5.3
4.4     4.6
3.9     4.5
3.8     4.4
3.5     4.4
3.4     3.5
3.4     3.4
3.2     2.8
3.2     2.7
2.9     1.6
2.7     1.5
2.6     1.2
If you look that much like a deserving Hall of Famer, you are probably deserving too.
Hall of Famers
It’s tremendous the advantage Cruz has over the likes of Chick Hafey and Heinie Manush. For my money, he’s also clearly better than relative contemporaries Jim Rice and Lou Brock. Further, I rank him ahead of Willie Stargell, Ralph Kiner, and Joe Medwick, though those three are close enough to debate.
Who to Dump
The comparison I want here is Lou Brock. Let’s dump Lou Brock! The Cardinal star had things a bit easier than Cruz with an AIR of 96. And he was really famous because of all the stolen bases and the 3000 hits, but let’s look at some other numbers too.
              Cruz     Brock
============================
PAs           8931     11240
Hits          2251      3023
Runs          1036      1610
Home Runs      165       149
RBI           1077       900
SB             317       938

So if you're a fan of counting stats, you prefer Brock.
==============================================================
BA            .284      .293
OBP           .354      .343
SLG           .420      .410
OPS+           120       109

But if you prefer rate stats, it seems Cruz has a little edge.
===============================================================
Rfield          77       -51
DRA          147.1     -25.5
The first is the defensive number at BBREF.
The second is defensive regression analysis. I trust the second more.
Either way, Cruz dominates.
=================================================================
Rbaser           3         78
No surprise, Brock was better on the bases.
=================================================================
Actual WAR      54.2       45.2
My Conversion   60.4       44.7
MAPES LF Rank     21         39
MAPES is my personal ranking system.
Cruz jumps up a bunch because of my DRA substitution.
It seems quite clear to me. If I could take one of these careers, I would take that of Jose Cruz. And if we got him into the Hall and Brock out of it, the Hall would be a better place. Or at least a more righteous one.
Next week we’ll take a look at Dwight Evans.
Miller
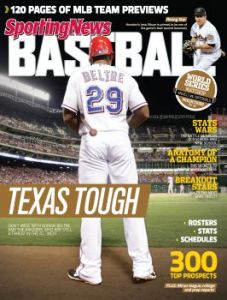
Just How Good Is Adrian Beltre?

Can Beltre finish his business and become one of the very best 3B ever?
Adrian Beltre has a chance to retire as the third greatest third baseman of all-time.
That’s how I began this little research project. If I can show that a frequently overlooked guy from Santo Domingo can retire with more value than George Brett or Wade Boggs, I’d really have something. People would read. Right? I know you’d read.
But I couldn’t just pontificate about Beltre’s greatness. I had to do the research. Which stinks.
When I was in graduate school, I railed against academic journals only publishing studies that found something specific at the expense of those that found nothing. If there’s a null finding, the research didn’t seem to be publishable. (Or so I understood). My lack of scholarly chops aside, I really thought I was onto something. Such a system, I postulated, might influence research to find something, even when nothing’s there. I thought publish or perish might trump professional ethics. Poppycock, I was told. Needless to say, I didn’t last long in grad school.
And this is the story of how Adrian Beltre, barring something utterly amazing in the next four to six years won’t retire at the level of Brett and Boggs. Here’s why.
DRA vs. Rfield
Around these parts we’ve discussed Michael Humphreys’ Defensive Regression Analysis before. In short, both Eric and I prefer DRA to the Rfield number that’s used in the calculation of BBREF WAR. Eric keeps a third of Rfield and substitutes two-thirds of DRA. I use a 30-70 split. And looking at Beltre, we should be able to show just one example of why DRA just makes more sense than Rfield.
Check out Beltre by age in both categories.
 Age Rfield DRA
19 1 4
20 13 14
21 7 9
22 -4 9
23 0 6
24 25 9
25 22 7
26 8 6
27 19 0
28 4 0
29 27 2
30 20 4
31 19 6
32 13 -1
33 13 -8
34 -5 -13
35 9 -12
Age    Rfield    DRA
19        1        4
20       13       14
21        7        9
22       -4        9
23        0        6
24       25        9
25       22        7
26        8        6
27       19        0
28        4        0
29       27        2
30       20        4
31       19        6
32       13       -1
33       13       -8
34       -5      -13
35        9      -12
Aside from a few down years playing aside Yuniesky Betancourt, Beltre’s numbers follow a very expected path according to DRA and a more surprising one according to Rfield. Should we really believe players don’t slow as they age? DRA and I think Beltre probably has. And that’s the problem if I want Beltre to slot behind only Schmidt and Mathews.
Among all players, Beltre is 25th in history per Rfield. At third he trails Brooks Robinson and not a single other player ever at the position. But DRA is another story. Brooks Robinson is still third at the position. And Buddy Bell (#3 by Rfield) is still #5. To be honest, the two defensive measures are quite similar at the hot corner. Clete Boyer, Graig Nettles, and Scott Rolen are all seen as great by both systems. But DRA sees Beltre as just good, #72 all-time. And there’s a pretty big WAR difference when we apply different defensive measures.
JAWS vs. MAPES
If you’re reading this, you’re probably familiar with JAWS, Jay Jaffe’s WAR Score. In its various incarnations it’s been around for as long as Beltre has been outstanding. MAPES is newer, circa 2013. It’s Miller’s Awesome Player Evaluation System. And I like to think it’s awesome-r than Jaffe’s. See, Jaffe needs to make his palatable to the masses, so it’s a pretty easy to digest. There’s nothing hard to follow about career WAR averaged with 7-year peak. With MAPES, I wasn’t trying to get things to the masses, so I altered WAR, and eschewed the 7-year peak by giving more weight to a player’s best season than his second, more weight to his second than his third, and so on. I also adjust for schedule, adjust for DRA, include consecutive greatness, and add in career value. I put it all in an Excel blender and serve. My system isn’t better than Jaffe’s. Except, well, it is. Mine only has to make sense to me, while his has to make sense to lots and lots of folks to gain mainstream appeal. (If anyone actually has an interest in my current MAPES formula, I’d be happy to share it).
To be clear, I’m just a guy with half a blog. Jay Jaffe is who I want to be when I grow up.
But still.
Los Angeles
 For me, Adrian Beltre has long been a fascinating guy. In 1998 he was ranked as the #3 prospect in all of the game by the folks at Baseball America. After mashing AA pitching to the tune of .321/.411/.581 in San Antonio, he was promoted to the bigs. On June 24, in his first ever trip to the plate, he hit an RBI double against Angel star Chuck Finley. (That hit, incidentally, scored Paul Konerko, the #2 prospect in the game). Six days later, he hit his first homer, a two-run shot off Rick Helling and the Rangers.
But one could say that he was somewhat of a disappointment as a Dodger through six seasons, which is a lot of seasons. Still, people probably shouldn’t have been disappointed. After all, Beltre averaged 2.8 WAR per season after that 1998 campaign and into his walk year. On the other hand, he posted only a 97 OPS+, indicating that he was a bit below average at the plate.
Beltre went into the 2004 season, his walk year, at the young age of 25. But he also went in seeing his batting average and on base percentage dip three straight years. And then came the breakout. Barry Bonds hit 45 homers in 2004. Young sluggers Albert Pujols and Adam Dunn each hit 46. But Beltre topped them all with 48 bombs. He was also fourth in the NL in batting average that year, after hitting just .240 in 2003. What’s more, he finished second in WAR and second in the MVP race to a deserving Barry Bonds.
Seattle
 That winter, Beltre was free. And eight days before Christmas, the Mariners signed him to a 5-year, $64 million contract. Oh, how the times have changed. Back in 2004, that was silly money. Then again, the M’s were locking up what seemed to be one of the best players in the game for his age 26-30 seasons. And to the uninitiated, Beltre was a bust.
He hit 48 homers his last season in LA, and then he averaged under 21 per annum in Seattle. I say he was a bust to the uninitiated for at least a couple of reasons. First, even the most optimistic Mariner fans couldn’t have expected him to replicate his amazing 8.5 WAR campaign of 2004. Second, Beltre was very good in the great northwest, averaging 3.3 WAR over his five seasons there. And even just in terms of home run power, Beltre was very good. He posted his second best, third best, and fourth best tater totals of his LA/SEA career when he was in the AL. Over the life of the contract, the M’s paid less than $4 million per win. It was a fine deal for the club.
Boston
 But baseball was down on Beltre, which meant that at just age 31 he’d have to settle for a one-year deal for only $9 million to handle the hot corner in Boston. It was a move to rejuvenate his value, and it certainly worked. While in Boston, Beltre made his first All-Star team and posted his second bit of Black Ink, pelting balls all around Fenway and leading the AL with 49 doubles. On top of that, his 28 homers were the second most of his career. Same with the 102 runs batted in and the .321 average. Value rejuvenated. And it should have been, as the no-longer-beleaguered Beltre put up 6.8 WAR for the Sawx.
Texas
 And this is where, Beltre fans, things get good. This is where things get really good. For the seven years of what should have been the prime of his career, Beltre averaged 4.6 WAR. That’s really impressive. What’s more impressive is that the actual prime of his career was yet to come. In the next four years – the last four years – when Beltre was 32-35, he was a 5.1 WAR player.
At this point some hard-core Beltre fans might be looking at my WAR numbers and scratching their heads. Well, you shouldn’t be. Remember the DRA/Rfield difference. That’s the main reason I see him as the only the 19th best 3B ever while JAWS puts him at #6.
Going Forward
Last season, at age 35, Beltre put up 5.3 WAR, a pretty outstanding year. But you have to figure he’s going to begin regressing soon. So I ran a couple of different models estimating four more seasons. One is a simple regression of a win per year. The other sees him lose half a win in 2015, one more win in 2016, and a win and a half in the next two. The first scenario slots him right below Graig Nettles in 15th place ever. The second puts him just ahead of Nettles in 14th place (please note that I rank both Paul Molitor and Edgar Martinez as 3B).
So what if I offered an aggressive next few seasons? Let’s say he repeats his 2014 this year and then regresses by half a win, a win, and a win and a half twice. If he did that, he’d still only vault to #10, between Paul Molitor and Brooks Robinson.
Conclusions
I started this study thinking Adrian Beltre might retire as the third best third sacker ever. It really doesn’t seem he has any shot of getting there. Even if he somehow had seven seasons remaining, one each at 7 WAR, 6 WAR, 5 WAR, etc., he still wouldn’t reach Brett and Boggs. But if he did that, I’d agree with Jaffe’s current ranking. I’d have him sixth ever, behind Schmidt, Mathews, Brett, Boggs, and Ron Santo.
But that’s not going to happen. He’s going to retire as about the 15th best 3B ever. Buddy Bell, Ken Boyer, Edgar Martinez, and Greg Nettles have been dealt with pretty poorly by the BBWAA, and I fear Beltre will get the same treatment. Not the HoME though. I expect that five years after he’s done he waltzes in.
Miller
Why We Elected Tommy Leach
![[Tommy Leach, Pittsburgh, NL (baseball)] (LOC)](https://i0.wp.com/farm3.static.flickr.com/2315/2163486436_4fea487e12_m.jpg "[Tommy Leach, Pittsburgh, NL (baseball)] (LOC)")
[Tommy Leach, Pittsburgh, NL (baseball)] (LOC) (Photo credit: The Library of Congress)
First off, we warned you a while ago that this might be coming.
Expanding the list we gave previously about why Leach has been so easy to overlook…:
- Overshadowed by teammates Honus Wagner and Fred Clarke
- .269 career batting average, only 63 career homers
- Only 46.8 career WAR, most folks look for 60 or more
- Well rounded player who rarely led league but was pretty good at everything
- He didn’t have a monster peak but was more consistent
- Defensive whiz instead of offensive star
- Played half his career at third base, a terribly overlooked Hall of Fame position
- Played half his career in centerfield as Cobb, Speaker, and Carey were emerging
- Deadball hitters are more difficult to get our heads around coming off the sillyball era
- Ditto deadball fielders
- Made his bones with a small market team
- Long dead, so no advocacy group
Some of these are easy to even off. Adjust his career WAR up about seven percent to put him into a 162-game context, and he’s up to 50.0. Now 50.0 WAR ain’t gettin’ no one elected by itself. Especially not some long-forgotten second-tier star. But as Miller and I talked through Leach, over many elections, we came to see three things areas where Leach had hidden value or changed how we looked at him.
HOW MANY KARATS IS THAT GOLD GLOVE?
This is the biggie for Wee Tommy.
Every defensive system says the same thing: that Tommy Leach was a great defender. It’s a matter of how great.
At one end, we have Michael Humphreys’ DRA. It’s the most commonsense, the most publicly tested, and the most open-source. DRA places Leach’s career defensive value at +251 runs. He ranks among the top 15 or so fielders ever in this system.
BBREF’s rfield, based on Sean Smith’s Total Zone, credits Leach with +66 fielding runs. That would place him 26th all time at third base or 29th in centerfield.
The spread is 185 runs, or about 18.5 Wins. That’s a big difference! It was time to seek independent third-party confirmation.
So, Win Shares. Or at least as interpreted by the Baseball Gauge on Seamheads.com. It shows Leach with 96 Fielding Win Shares (FWS). This is the 56th highest total of all time. At third base he would rank third all time, trailing only Lave Cross and Brooks Robinson. In centerfield, Leach also ranks third, just behind Speaker and Mays. Not bad.
In Win Shares, James rates Leach as an A+ fielder at both third base and centerfield. At third, Leach earned the sixth highest FWS/1000-innings rate of anyone above 3000 innings in the field. In centerfield, he has the eighth best rate of FWS/1000 among outfielders with 6700 or more innings.
Win Shares is not easily convertible to runs above average, or else I’d tell you what it sees in those units. Suffice it to say, it digs Tommy Leach almost as much as DRA. Heck, just for fun I even looked him up in the old Total Baseball Fielding Runs: +108 with the glove.
Leach’s glove is confirmed as outstanding and possibly historic.
Me? I take a 2/3 to 1/3 approach with DRA and rfield, which reduces DRA’s rational exuberance. That means that I see him as having as much as 190 runs of value, or about 12 more Wins of value than BBREF’s WAR suggests. Your mileage may vary, but even if you just split the difference, there’s still as much as nine more Wins of value out there for Leach.
NO BASES FOR COMPARISON?
BBREF has Leach at -4 runs of base-running value. I’m thinking that’s a little low.
The gang at the world’s great website uses a combination of team and individual stolen-base attempt information to estimate that value. In reality, we know almost nothing about the value in his legs because we have little caught-stealing and no base-advancement data for Leach’s era.
So what can we know? We can’t know exact numbers, but we can assess whether the BBREF estimate makes sense or not. For Leach it may not.
Let’s start dissecting Leach’s base running with his fielding record.
Leach spent half his career as an outstanding third baseman where he needed:
- agility on bunt attempts
- quick reactions to spear hard-hit balls while guarding against the bunt
- nerve to play in on righties and take the abuse base runners dished out.
Injury forced Leach to centerfield where he relied on an expanded set of abilities:
- quick reaction times
- ability to read drives and assess their playability
- flat-out, point-to-point acceleration.
Agility, quick reactions, daring, sprinting ability, and split-second decision making are also the hallmarks of excellent baserunners.
Leach’s offensive record is weird. He’s 23rd all-time with 172 triples, and his 49 inside-the-park home runs are both a National League record and an MLB record for right-handed hitters. Triples often denoted deadball slugging, but Leach was hardly known as a power hitter in the sense we understand it today. He explained his extra-base hitting this way:
“Sometimes they played me right in back of the infield. Every so often, I’d manage to drive a ball between the outfielders and it would roll to the fence. I was pretty fast, and by the time they ran the ball down and got it back to the infield, I’d be home.
Turns, out that Leach’s home field, helped a lot. Here are Exposition Park’s dimensions (hat tip: Green Cathedrals):
- Left Field: 400 feet
- Left Center: 461 feet
- Center Field: 515 feet
- Right Center: 439
- Right Field: 380
More like a national park than a national league park.
You’ll notice in the inside-the-park link above that four 1900s Pirates made that inside-the-park homers list—the ballpark had a huge influence. But. Leach was a righty swinger, and he topped left-handed teammate Clarke (who, in fairness, was a few years older), by twenty inside-the-parkers. The closest Pirate to Leach, and just two behind, was Wagner whom BBREF rates as a +33 runner. Wagner stole twice as often as Leach, yet Leach hit as many inside-the-parkers. Could be a lineup effect, of course, and we don’t have that information yet. However, Wagner also led the NL in doubles seven times, while Leach never got close. Why?
Look back at his quote above. The lack of doubles and preponderance of triples and ITP homers suggests that Leach’s self-description is accurate. Why would opponents play Leach close to the infield? Because a) they didn’t think he could hit it very far like Wagner could. And because he was fast enough and daring enough to turn singles into hustle doubles if they played him back. That’s why the gaps were opened to him.
The park actually leads us to another link in this daisy-chain of evidence. Fred Clarke player-managed Leach for parts of fifteen seasons with the Louisville Colonels (1898–1899) then the Pirates (1900 through half of 1912). Here are how his Pirates teams ranked in the NL during Leach’s years and the one-year park factors for The Expo:
    R/G  2B   3B   HR   SB    K   BB   SH   AVG  SLG  PF1
==========================================================
1900  4    4    1    6    8    5    8    3    6    5   103
1901  2    4    3    7    7    7    2    4    2    3   101
1902  1    1    1    2    2    7    2    4    1    1   106
1903  1    2    1    1    4    8    6    5    2    1   105
1904  3    5    1    8    6    5    4    7    2    3    99
1905  4    2    2    4    3    5    6    4    3    3   104
1906  3    3    5    6    6    8    4    2    2    2   104
1907  1    6    2    3    1    7    2    4    1    1   105
1908  3    4    1    2    4    7    2    6    3    3    95
1909  1    1    1    2    4    6    3    2    1    1   105
1910  3    3    3    2    8    5    6    3    3    3   112
1911  3    5    1    3    7    6    6    2    3    3   102
1912  3    5    1    4    5    6    8    2    2    1    99
----------------------------------------------------------
AVG  2.5  3.5  1.8  3.8  5.0  6.3  4.5  3.7  2.4  2.3  103.1
Clarke seems to have built his offenses around his ballpark. He looked for players whose skills matched it: contact-hitters with line drive bats. He was meh on one-run strategies, and when you look at how frequently his stars bunted, the basic strategy was “Not with Wagner.” The same was inversely true with the other one-run tactic, stolen bases. Clarke let Wagner and later Max Carey run wild. Between them, they led the league in thefts seven times during Clarke’s managing career. But unlike contemporaries John McGraw or Hughie Jennings, Clarke didn’t set his whole team loose. Wagner and Carey often led the team by ten or twenty bags. Clarke’s teams usually featured two or three other players with 20+ steals, but only once (1907) did more than one player steal 30 times successfully in a season. During his Pirates tenure, Leach, one of the few Clarke ran regularly with, stole in eleven percent more of his estimated times on first base (H – 2B – 3B – HR + BB + HPB) than his leagues, but a whopping thirty-six percent more often than his Pirates teammates.
I think Clarke was, in a broad sense, something like Earl Weaver as a manager. He tended to put players into situations that best fit their skills, waited for the three-run triple, and put a premium on strong defenders. What we don’t know is what kind of percentage stealers his teams were and how aggressive they were station-to-station.
So let’s wander back to Tommy Leach’s base running.
- Narrative and statistical evidence suggest Leach could run very fast
- His fielding record also contributes to that idea and adds to it some likelihood that he possessed a strong ability to read plays as they developed
- Leach’s park may have reduced his stolen base attempts because he ended up on third (or home) on balls in play more frequently than he would have in other parks
- Fred Clarke didn’t run very frequently but did bunt a bit, reducing Leach’s opportunities
If all or the bulk of this evidence is accurate, then BBREF’s estimate of Leach’s base-running value is likely too low, and possibly very low. Once play-by-play and split data become available we will confirm this evidence and be able to put a number to it. For now, I, at least, see evidence of hidden value in Leach’s legs.
POSITIONED FOR OBSCURITY
Among some or all of a schedule adjustment, additional fielding value, and the possibility of additional base-running value, our assessment of Leach could jump from deadball dead end to compelling candidate.
But Leach had one final issue to overcome. Perception, or our ability to even grasp what he was about. Leach played about 1000 games at both third and center. A PI search on BBREF for all players with more than 500 career games who played >40% of the time at both 3B and CF returns one name: Tommy Leach. I had to reduce the threshold to 26% to get another name on the list, and that guy played nearly 1000 fewer games.
When something is as weird as this, it’s easier to just hand wave it away. A fluke. An aberration. Third basemen that shift to first? Makes sense. Centerfielders that go to a corner or to first? OK, sure. But this? This is weird.
As a third basemen, Tommy Leach would be pretty close to Jimmy Collins. As a centerfielder, he would be pretty close to Max Carey. Collins and Carey, while similarly valuable are such different player-types that it’s hard to get your footing. Then you start talking about the guys just below, Sal Bando or Bernie Williams, or even guys at other positions, and…. You get the picture.
Ultimately, we felt that Leach’s defense was the tipping point. Looking deeply into his base running and a close look at how position was influencing our thinking were the last dominos.
Welcome to our HoME, Tommy Leach. At least in one place you aren’t just Wee Tommy anymore.
A Leach that Doesn’t Suck: Getting to Know Wee Tommy
![[Tommy Leach, Chicago NL (baseball)] (LOC)](https://i0.wp.com/farm4.static.flickr.com/3289/5793152161_0fa81c0968_m.jpg "[Tommy Leach, Chicago NL (baseball)] (LOC)")
[Tommy Leach, Chicago NL (baseball)] (LOC) (Photo credit: The Library of Congress)
And why should it? Tommy Leach played 100 years ago in one of baseball’s smaller markets. He was a smallish guy, thus the nickname. He’s not in the Hall of Fame, and his case doesn’t come up with the Veterans Committee, ever. As we’ve looked deeper at his career for the HoME, the contexts that cause people to ignore him become obvious, as do the strengths of his case. All of which also brings up the stuff that makes him vexing. We’re grappling with him, so we thought we’d share a little about him with you.
Like many less-heralded players, Leach did a lot of things well, but he didn’t do the sexy things that make ballplayers famous.
- He hit .269 (in a .266 context) while Keeler, Wagner, and Cobb’s exploits made headlines.
- Thanks to a decent eye his on-base percentage was nine points above the league.
- Like everyone else in the deadball era, he didn’t hit many homers (63, 49 inside-the-parkers), though they were the 13th most of any player during his career. He did hit a lot of triples, a deadball indicator of power (172, twenty-third all-time, fourteenth when he retired), so his slugging percentage was twenty points higher than the league.
- On the basepaths he stole 361 times a good total but not noteworthy in a stealtastic era.
So we have an offensive player who is pretty good at a bunch of things, but whose best skill (hitting triples) soon went out of vogue when Babe Ruth started swinging for the fences. Besides this offensive profile, memories of Leach are blurred or faded for three other reasons.
1.) Honus Wagner and Fred Clarke. Leach had great taste in teammates, even if they overshadowed him. Wagner was only the greatest position player in NL history before Stan Musial. Perhaps even after Musial. Clarke was the Pirates’ on-field leader, famed as the team’s longtime player-manager who led them to multiple World Series appearances. Not to mention that he was a perennial All-Star-type player.
2.) Position. Right, smack-dab in the middle of his career, after two broken ribs inhibited his throwing motion, Leach switched from third base to centerfield. Inconceivable today in an era when third basemen hit for power and are expected to have quick feet but not foot speed. The closest modern parallel is Robin Yount moving from short to centerfield, but at least in that case shortstops are supposed to have speed. Then you have the fact that moving in mid-career made it more difficult for people to remember Leach as either.
3.) His defensive performance. Defensive stand-outs do get recognized by the Hall and other institutions. But there is divided opinion on Leach’s defense: it may have been merely very good or historic. On the side of historic, DRA sees him as a top-ten third baseman and an outstanding centerfielder while Bill James’ Win Shares shows him as the sixth and seventh most effective gloves on a per 1000 innings basis at center and third respectively. On the merely very good side, BB-REF’s rfield would place his career defensive value between 25 and 30 at either position.
For our purposes here at the HoME, we don’t care much about points one and two. We can leave the Hall in Cooperstown to deal with its own blind spots. But our individual interpretations of Leach’s defense will determine whether Leach is in or out of our Hall. The difference between DRA and bb-ref’s fielding stats is a swing of 100 to 200 runs, depending on how much you stock you put in each. A win is worth 10 runs, and 10 Wins takes him from also ran to borderline candidate. Twenty pushes him up to even with Jimmy Collins and a strong candidate to get a vote soon.
And we’re still puzzling. Defensive measurements simply aren’t as closely agreed upon as offensive ones. For today, however, we’ve at least done our part to hoist Tommy Leach a little further out of undeserved obscurity by introducing him to you.
—Eric
Charlie Bennett Goes Saberhagen

Does this man belong in the HoME?
The Hall of Miller and Eric is a collaborative process. It has to be. And per our rules, we must select 209 players for induction by the tie we complete our 2013 election. Those same rules tell us that nobody gets inducted without a vote from both of us. Thus, players who get votes from one of us need tremendous consideration from the other. Otherwise we’re going to run into quite a predicament when we get to our last few elections.
Eric has voted for three players – George Wright, Paul Hines, and Charlie Bennett in each of our six elections. And while I haven’t voted for any of them yet, I’ve maintained from the start that George Wright is a very strong candidate who will very likely receive my vote one day. And I’ve recently decided that there’s about a 70% chance I vote for either Paul Hines or center field contemporary Pete Browning at some point. But I’ve never given serious consideration to Eric’s third solo nominee, Charlie Bennett.
Charlie Bennett was a catcher whose career lasted 15 years in the National League (1878, 1880-1893). Unlike many catchers of the period, Bennett was a true backstop, playing 88% of his innings behind the plate. In order to get a better grasp on Bennett and see what Eric’s votes have been all about, I’m going to run the durable catcher through our Saberhagen List to see if anything comes to the surface for me.
Full disclosure, I go into this exercise wanting to vote for Charlie Bennett. Either that or I hope my results tell Eric that he should stop doing so. Let’s see what happens!
1. How many All-Star-type seasons did he have?
One way to measure this is to look at his WAR compared to other NL catchers each year of his career. Since there were never more than eight teams in the NL until his last two seasons, he’d have to lead catchers in WAR or be pretty darn close to have an All-Star type season. For the last two, first or second would be fine.
1878: 7th
1880: 4th
1881: 1st, by a good margin
1882: 1st, by a good margin
1883: 1st, toss-up between him and Buck Ewing
1884: 3rd
1885: 1st
1886: 1st
1887: 3rd
1888: 3rd, very close to the top spot
1889: 8th
1890: 2nd
1891: 5th
1892: 16th
1893: 16th
It seems clear that Bennett played at an All-Star level in 1881, 1882, 1885, and 1886. He certainly could have been called the best catcher in the game in 1883 and 1888 too.
2. How many MVP-type seasons did he have?
For a catcher, this is trickier than for most players. Catcher is a tough position to play today, and it was just brutal 120 years ago. It was the seventh year of Bennett’s career before chest protectors came into use. And it wasn’t until 1891, when Bennett had only three more years to play, that large padded mitts were allowed. So we should be more lenient for Bennett than for some others. We’ll consider all of the times he was in the top-10 in the NL in WAR for position players.
1881: 2nd, trailing Cap Anson by 1.6 WAR
1882: 6th, trailing Dan Brouthers by 1.8 WAR
1883: 3rd, trailing Dan Brouthers by .9 WAR
1885: 5th, trailing Roger Connor by 3.7 WAR
By this measure, we can only consider three seasons. He just wasn’t close to Connor in 1885. For the others, let’s look at DRA so we can get a grasp of Bennett’s contribution behind the plate. He wasn’t a very good catcher in 1881. He was good in 1882, but perhaps not enough to jump past five players. In 1883, however, he was very good. I can see a reasonable case that he was the best player in the game that year.
3. Was he a good enough player that he could continue to play regularly after passing his prime?
There’s lots of gray here. Depending on how one views his prime, the case could be made that he hung on for as many as five or as few as two seasons after that period ended. A more fair measure for Bennett is to say that he had a long and productive career for a 19th century catcher.
4. Are his most comparable players in the HoME?
It’s still pretty early in our process for this question. With the caveat that it’s a sub-optimal measure, there are only three catchers in Bennett’s era within 15 WAR of his 39.1. Buck Ewing has beats him with 47.7, and he’s already in the HoME. Jack Clements has 32.0, and we continue to review his candidacy without either of us voting for him yet. The same can be said of Deacon McGuire and his 31.1 WAR.
But the comparison to Ewing might sell Bennett short some. Ewing caught less than half the time. Bennett, as mentioned above, was behind the plate 88% of the time. And while Clements and McGuire caught a similar number of games to Bennett, neither was as talented with the bat or the glove.
I’m not sure Charlie Bennett has any other truly comparable players in the history of baseball.
5. Does the player’s career meet the HoME’s standards?
I suppose he’d bring the average value of the HoME down, but there are a lot of reasons I don’t care about that.
6. Was he ever the best player in baseball at his position? Or in his league?
When running Jimmy Collins through Saberhagen not long ago, Eric brought forth the idea of looking at a three-year run as a sign of positional dominance. Let’s see how Charlie Bennett fares by this measure.
• 1878¬-1880: 9th
• 1879-1881: 5th
• 1880-1882: 1st
• 1881-1883: 1st
• 1882-1884: 1st
• 1883-1885: 1st (dead heat with Buck Ewing)
• 1884-1886: 1st
• 1885-1887: 1st
• 1886-1888: 3rd (King Kelly and Ewing)
• 1887-1889: 3rd (Ewing and Fred Carroll)
• 1888-1890: 5th
• 1889-1891: 10th
• 1890-1892: 10th
• 1891-1893: 11th
It could be argued that this is pretty compelling stuff. For six consecutive three-year periods, Bennett was the best catcher in baseball. Let’s not get too excited though – there were only seven other starting catchers.
7. Did he ever have a reasonable case for being called the best player in baseball? Or in his league?
From 1881-1883, he notched 13.3 WAR compared 13.8 for Dan Brouthers. Given the difficulty of catching, one could argue that Bennett was the game’s best player for that period. Perhaps one should argue that.
8. Is there any evidence to suggest that the player was significantly better or worse than is suggested by his statistics?
Here we have to bring up his position again. There’s no doubt that squatting, catching, and being bombarded by baseballs took away from his hitting ability.
9. Did he have a positive impact on pennant races and in post-season series?
Through 1885, Bennett played on only mediocre to terrible teams. His Detroit Wolverines were a strong team in 1886, but they lost out to the Chicago White Stockings. In 1887, Wolverines won the NL title and beat the American Association’s St. Louis Browns 10 games to 5 in what was the exhibition equivalent of the World Series. Bennett hit .262/.311/.357 on a team that hit .243/.275/.326. He was fine.
By 1891, Bennett was a member of the Boston Beaneaters, winners of the NL pennant. There was no post season that year. Even if there had been, Bennett’s career was winding down. He wasn’t one of his team’s best players. By the time the Beaneaters won the NL pennant in 1892, Bennett wasn’t a very good player. In the Championship Series against the NL’s second best team, the Cleveland Spiders, Bennett was a back-up who came to the plate just seven times during Boston’s 5-0-1 victory, though he did homer. Boston won again in 1893, Bennett’s final season, but again there was no post-season.
Bennett’s impact on pennant races and post-season series is negligible.
10. Is he the best eligible player at his position not in the HoME?
Maybe. Or maybe it’s the newly eligible Roger Bresnahan. I think I prefer Bennett, though I haven’t yet given it a lot of thought. I’m quite confident Eric prefers Bennett, calling him the second best catcher before Gabby Hartnett.
11. Is he the best eligible candidate not in the HoME?
I don’t think so. Right now, I prefer Monte Ward.
At no point has Eric ranked him the best among those eligible, always ranking George Wright, Paul Hines, or both higher.
Though the 1931 class is generally weak, I believe Home Run Baker, at least, is also a better candidate.
Okay, we’ve now answered all of the questions. And I’m not yet compelled to vote for our man Bennett. But I have three more questions I want to answer first. If I can answer any of these in the affirmative, I might be forced to change my mind.
1. Is his position within his era grossly underrepresented in the HoME?
No, it’s not. We’ve elected a 19th century catcher in Buck Ewing. There would be nothing wrong with having a second, but we certainly don’t need one.
2. Is his era, in general, grossly underrepresented in the HoME?
No, it’s not at all. We have nineteen guys from the 19th century in the HoME right now, which I think is an underrepresentation but not a gross underrepresentation. Should we get another 180 or so players into the HoME without giving that honor to another 19th century guy, there might be a problem. Right now, I’m comfortable with the era’s representation.
3. Is his position, in general, grossly underrepresented in the HoME? No, it’s not at this moment. We’ve elected Buck Ewing from his era and nobody yet from the first quarter of the 20th century. That omission isn’t necessarily a bad thing. However, unless there’s much more love for Roger Bresnahan or Ray Schalk than I’m anticipating, we’re not going to elect another catcher until Mickey Cochrane comes up in 1946 (Gabby Hartnett began his career earlier but ended it later, so he’s not eligible until 1951). While I see no problem today, I think there may be an issue as we move forward.
Based on Eric’s voting record and his stated reason for putting Bennett on his ballot, he’s already noticed this catcher problem. I don’t want to turn a blind eye to it, nor do I want to vote for someone about whom I’m just not certain.
This exercise has not convinced me to vote for Charlie Bennett in 1931. It has, however, moved me to believe there’s a better than 50% chance I’ll be compelled to vote for him at some point. I expect that I’ll continue to consider Bennett for many, many elections.
Miller
Jimmy Collins Goes Saberhagen

Jimmy Collins, 3B, 1895-1908
A few weeks ago we put George Wright through the Saberhagen List without really coming to a conclusion. Now, we’re ready to apply it to Jimmy Collins, the third baseman who played most of his career in Boston – with the Beaneaters of the NL and the Americans of the AL.
He’s a difficult candidate because third base is a difficult position. Read on to find out why.
This is how Eric answered the questions as he prepared his 1921 ballot.
1. How many All-Star-type seasons did he have? At least 5 seasons of 5.0+ raw WAR. My equivalent WAR (eqWAR) gives him 6.
2. How many MVP-type seasons did he have? None by raw WAR. According to eqWAR, 1898 was an MVP level season, and 1901 was close at 7.2 eqWAR.
3. Was he a good enough player that he could continue to play regularly after passing his prime? He played until he was 38, didn’t start until 25, and played regularly through the end.
4. Are his most comparable players in the HoME? It’s a bit early in our process for this question, and also his comps on bb-ref aren’t very accurate. I believe he is compared to inferior players. They all played longer schedules and later in history when their leagues were at a higher offensive levels than most of Collins’ seasons. Pre-War 3B is pretty odd, and others have grappled with this question before us. As a point of reference, Collins is in all three of the Halls I consult (Hall of Fame, Hall of Merit, Hall of Stats). Of those spotty bb-ref comps, Home Run Baker is in all three. George Kell is in the HOF but is a mistake. Paul Hines is in the HOM. JAWS sees him as below the average HOF 3B and as the 17th best eligible 3B. However, it lists Paul Molitor and Edgar Martinez as 3Bs (they’re clearly designated hitters), and it lists Dick Allen as a 3B, which it appears is inaccurate as well. So Collins is more like the 14th best eligible by JAWS. The guys below seem inferior at first blush. But since they also may not be great candidates, we don’t learn much by looking at them.
5. Does the player’s career meet the HoME’s standards? Not currently, though there are only 16 guys enshrined, and they are uniformly top-10 type players at their positions.
6. Was he ever the best player in baseball at his position? Or in his league? Collins crushes all other career-long 3Bs of his era for career value by raw WAR. From 1895–1908, Collins’ 53.1 raw WAR are 14 more than the second-place third baseman. In fact, he’s the best 3B in history from 1871 to 1917 by raw WAR. In 1918, he’s passed by Home Run Baker, the best 3B between Deacon White and Eddie Mathews. Collins’ raw WAR is second best to Baker among all 3Bs from 1871 through 1958. Let’s let that echo for a moment–he’s second best at his position over nearly a 90 year period. There are other legitimate candidates to this faux throne, however. Looking at eqWAR behind White and Baker, we see Ezra Sutton (65) and Tommy Leach (64), who have pretty much the same career value as Collins’ 63 and are near enough that it’s not worth haggling about. Ned Williamson follows close behind at 58 eqWAR. Sutton’s total is much more approximate and came during a time of lesser overall competition. As for Leach, I see him as a third basemen even though he played a few more career games in center field. Because of changes in schedule length during his career, he played a higher percentage of his teams’ games at third base (46% at third; 40% in center). Still that doesn’t say much for his ability to stick at third base. YMMV. That said, Collins’ peak (34 best-5, 44 best-7) ties with John McGraw’s and Williamson’s as the second best behind Baker’s (40 best-5 and 52 best-7).
I think a strong expression of positional dominance is to look at every three-year stretch in a player’s career. How often was he the best for a three-year period? The first year could be a fluke. The second year is the show-me year. In the third year, you get crowned. Here’s his record in such periods:
- 1895–1897: #1
- 1896–1898: #1a (trails McGraw by a tenth of a win, effectively tied)
- 1897–1899: #2 (McGraw)
- 1898–1900: #2 (McGraw)
- 1899–1901: #2 (McGraw)
- 1900–1902: #1
- 1901–1903: #2 (Bill Bradley)
- 1902–1904: #2 (Bradley)
- 1903–1905: #2 (Bradley)
- 1904–1906: #3 (Jim Devlin, Bradley)
- 1905–1907: #5
- 1906–1908: #7
Two or three times the best in his league over a three-year period. Clearly the best over longer periods. And in the longer term, the best between White and Baker, and the best exclusive third baseman before Baker (White spent many seasons behind the plate and a couple in the outfield).
7. Did he ever have a reasonable case for being called the best player in baseball? Or in his league? No. Ed Delahanty, Honus Wagner, Nap Lajoie, et al were in the leagues he was in.
8. Is there any evidence to suggest that the player was significantly better or worse than is suggested by his statistics? DRA likes his defense better by about 50 runs than rfield. He was regarded as finest defensive 3B of his day and is widely credited with creating the modern style of 3B play. Plus, as we’ve discussed, third base was really different back then. Here’s probably the best handful of third basemen before Eddie Mathews by my methods, ordered by CHEWS, which is my answer to JAWS. (CHEWS values peak more than JAWS does.) The list is somewhat different than what you’d find on the JAWS pages, as you might guess.
- Deacon White: 85 career eqWAR, 42 best-7, 61.3 CHEWS
- Frank Baker: 68 career eqWAR, 52 best-7, 58.9 CHEWS
- Jimmy Collins: 63 career eqWAR, 44 best-7, 52.6 CHEWS
- Tommy Leach: 64 career eqWAR, 41 best-7, 51.0 CHEWS (Leach could just as easily be a CF)
- Ned Williamson: 58 career eqWAR, 44 best-7, 50.5 CHEWS
- Ezra Sutton: 65 career eqWAR, 34 best-7, 47.9 CHEWS
- John McGraw: 51 career eqWAR, 43 best-7, 46.9 CHEWS
- Heinie Groh: 54 career eqWAR, 38 best-7, 45.3 CHEWS
Even with all the stuff I adjust for, none of the guys below Baker are likely above average HoMErs. Collins might actually be exactly average. I believe the pittance of third base talent before the War may have something to do with the rougher style of play, so much more base-stealing, and so many more triples. The injury rate of top third basemen in that era is very high and could easily result from more contact plays. Collins’ durability in that rough and tumble day may be something special that is not well captured or well known.
9. Did he have a positive impact on pennant races and in post-season series? His World Series performance in 1903 was mediocre. His teams finished first in 1897, 1898, and 1904, but there was no championship series in those years.
10. Is he the best eligible player at his position not in the HoME? Yes, until Baker. Once Baker gets in, he’ll be the best until the 1970s when Mathews, Ken Boyer, and Ron Santo come along. They are the first wave of the tsunami of modern third basemen.
11. Is he the best eligible candidate not in the HoME? No. The case for Collins is neither weak nor strong. It’s the case of someone who is below the ultimate institutional average.
What happened on the field happened, but it seems strange to me that there’s something endemic to the position that suppresses value for 80 years. Especially when the more difficult defensive position of shortstop simultaneously spawned longer careers with higher quality hitting and better peaks. What I also don’t know is whether or how at an institutional level we address this. It would seem strange also to have only two third basemen (presumably Baker and White) for more than half of baseball’s history.
So once again we run Saberhagen, and there are as many questions as answers. While that’s frustrating in the short term, it likely puts us in a position for a better HoME as we progress.
–Eric and Miller
Thinking about fielding: Dr. DRA in the House

Ned Williamson (Photo credit: Wikipedia)
If you’ve ever bought a house, you know that when you step into that just-right house, you know it. That’s how I felt about Michael Humphreys’ book Wizardry. Conceptually, Humphreys’ Defensive Regression Analysis (DRA) does some very commonsense things that I immediately liked:
- It starts with the team, not the player
- It avoids the cross-contamination that plagues zone-based systems
- It makes use of freely available fielding statistics.
- Keith Hernandez: 60 WAR / 117 Rfield / 220 DRA / ~7 WAR difference
- Dick Allen: 59 WAR / -110 Rfield / -54 DRA / ~3 WAR difference
- Cupid Childs: 44 WAR / 28 Rfield / 122 DRA / ~6 WAR difference
- Bobby Doerr: 51 WAR / 43 Rfield / 80 DRA / ~3 WAR difference
- Jeff Kent: 55 WAR / -42 Rfield / -2 DRA / ~3 WAR difference
- Tommy Leach: 47 WAR / 67 Rfield / 251 WAR / ~12 WAR difference
- Darrell Evans: 59 WAR / 37 Rfield / 170 DRA / ~9 WAR difference
- Ned Williamson: 36 WAR / 87 Rfield / 140 DRA / ~4 WAR difference
- Joe Tinker: 53 WAR / 180 Rfield / 314 DRA / ~9 WAR difference
- Artie Fletcher: 47 WAR / 144 Rfield / 277 DRA / ~9 WAR difference
- Dave Bancroft: 49 WAR / 93 Rfield / 162 DRA / ~5 WAR difference
- Jimmy Sheckard: 50 WAR / 77 Rfield / 265 DRA / ~13 WAR difference
- Bobby Veach: 48 WAR / 30 Rfield / 188 DRA / ~11 WAR difference
- Roy White: 47 WAR/ 35 Rfield / 179 DRA / ~10 WAR difference
- Brian Giles: 51 WAR / -28 Rfield / 13 DRA / ~3 WAR difference
- Mike Griffin: 41 WAR / 66 Rfield / 240 DRA / ~12 WAR difference
- Richie Ashburn: 63 WAR / 76 Rfield / 210 DRA / ~9 WAR difference
- Bernie Williams: 50 WAR / -139 Rfield / -58 DRA / ~5 WAR difference
- Brett Butler: 50 WAR / -84 Rfield / -8 DRA / ~5 WAR difference
- Max Carey: 54 WAR / 86 Rfield / 152 DRA / ~4 WAR difference
- Jimmy Wynn: 56 WAR / -28 Rfield / 29 DRA / ~3 WAR difference
- Harry Hooper: 54 WAR / 77 Rfield / 213 DRA / ~9 WAR difference
- Sam Rice: 53 WAR / 56 Rfield / 152 DRA / ~6 WAR difference
